


Running large-scale AI/ML workloads on Kubernetes can feel like navigating a labyrinth of resource allocations, security hurdles, and monitoring demands—especially if you don’t have a solid plan in place. Sure, it’s exciting to see neural network tasks like image recognition or churn prediction, but there’s always the concern about pushing your cluster to its limits.
MLOps is a friendly anchor here, bridging the gap between data scientists, DevOps folks, and security teams as a set of ideas and tools that help you keep track of model creation, testing, and release. It encourages tight collaboration, so a data scientist on one team and a Kubernetes guru on another can confidently update a model without stepping on each other's toes. When MLOps meets container orchestration, you get a more predictable way of controlling AI pipelines.
Our goal with this article is to share the best practices for running complex AI tasks on Kubernetes. We'll talk about scaling, scheduling, security, resource management, and other elements that matter to seasoned platform engineers and folks just stepping into machine learning in Kubernetes. By walking through each section, you'll pick up practical tips to shield your cluster from AI security risks, keep your costs in check, and give your models the computing power they crave.
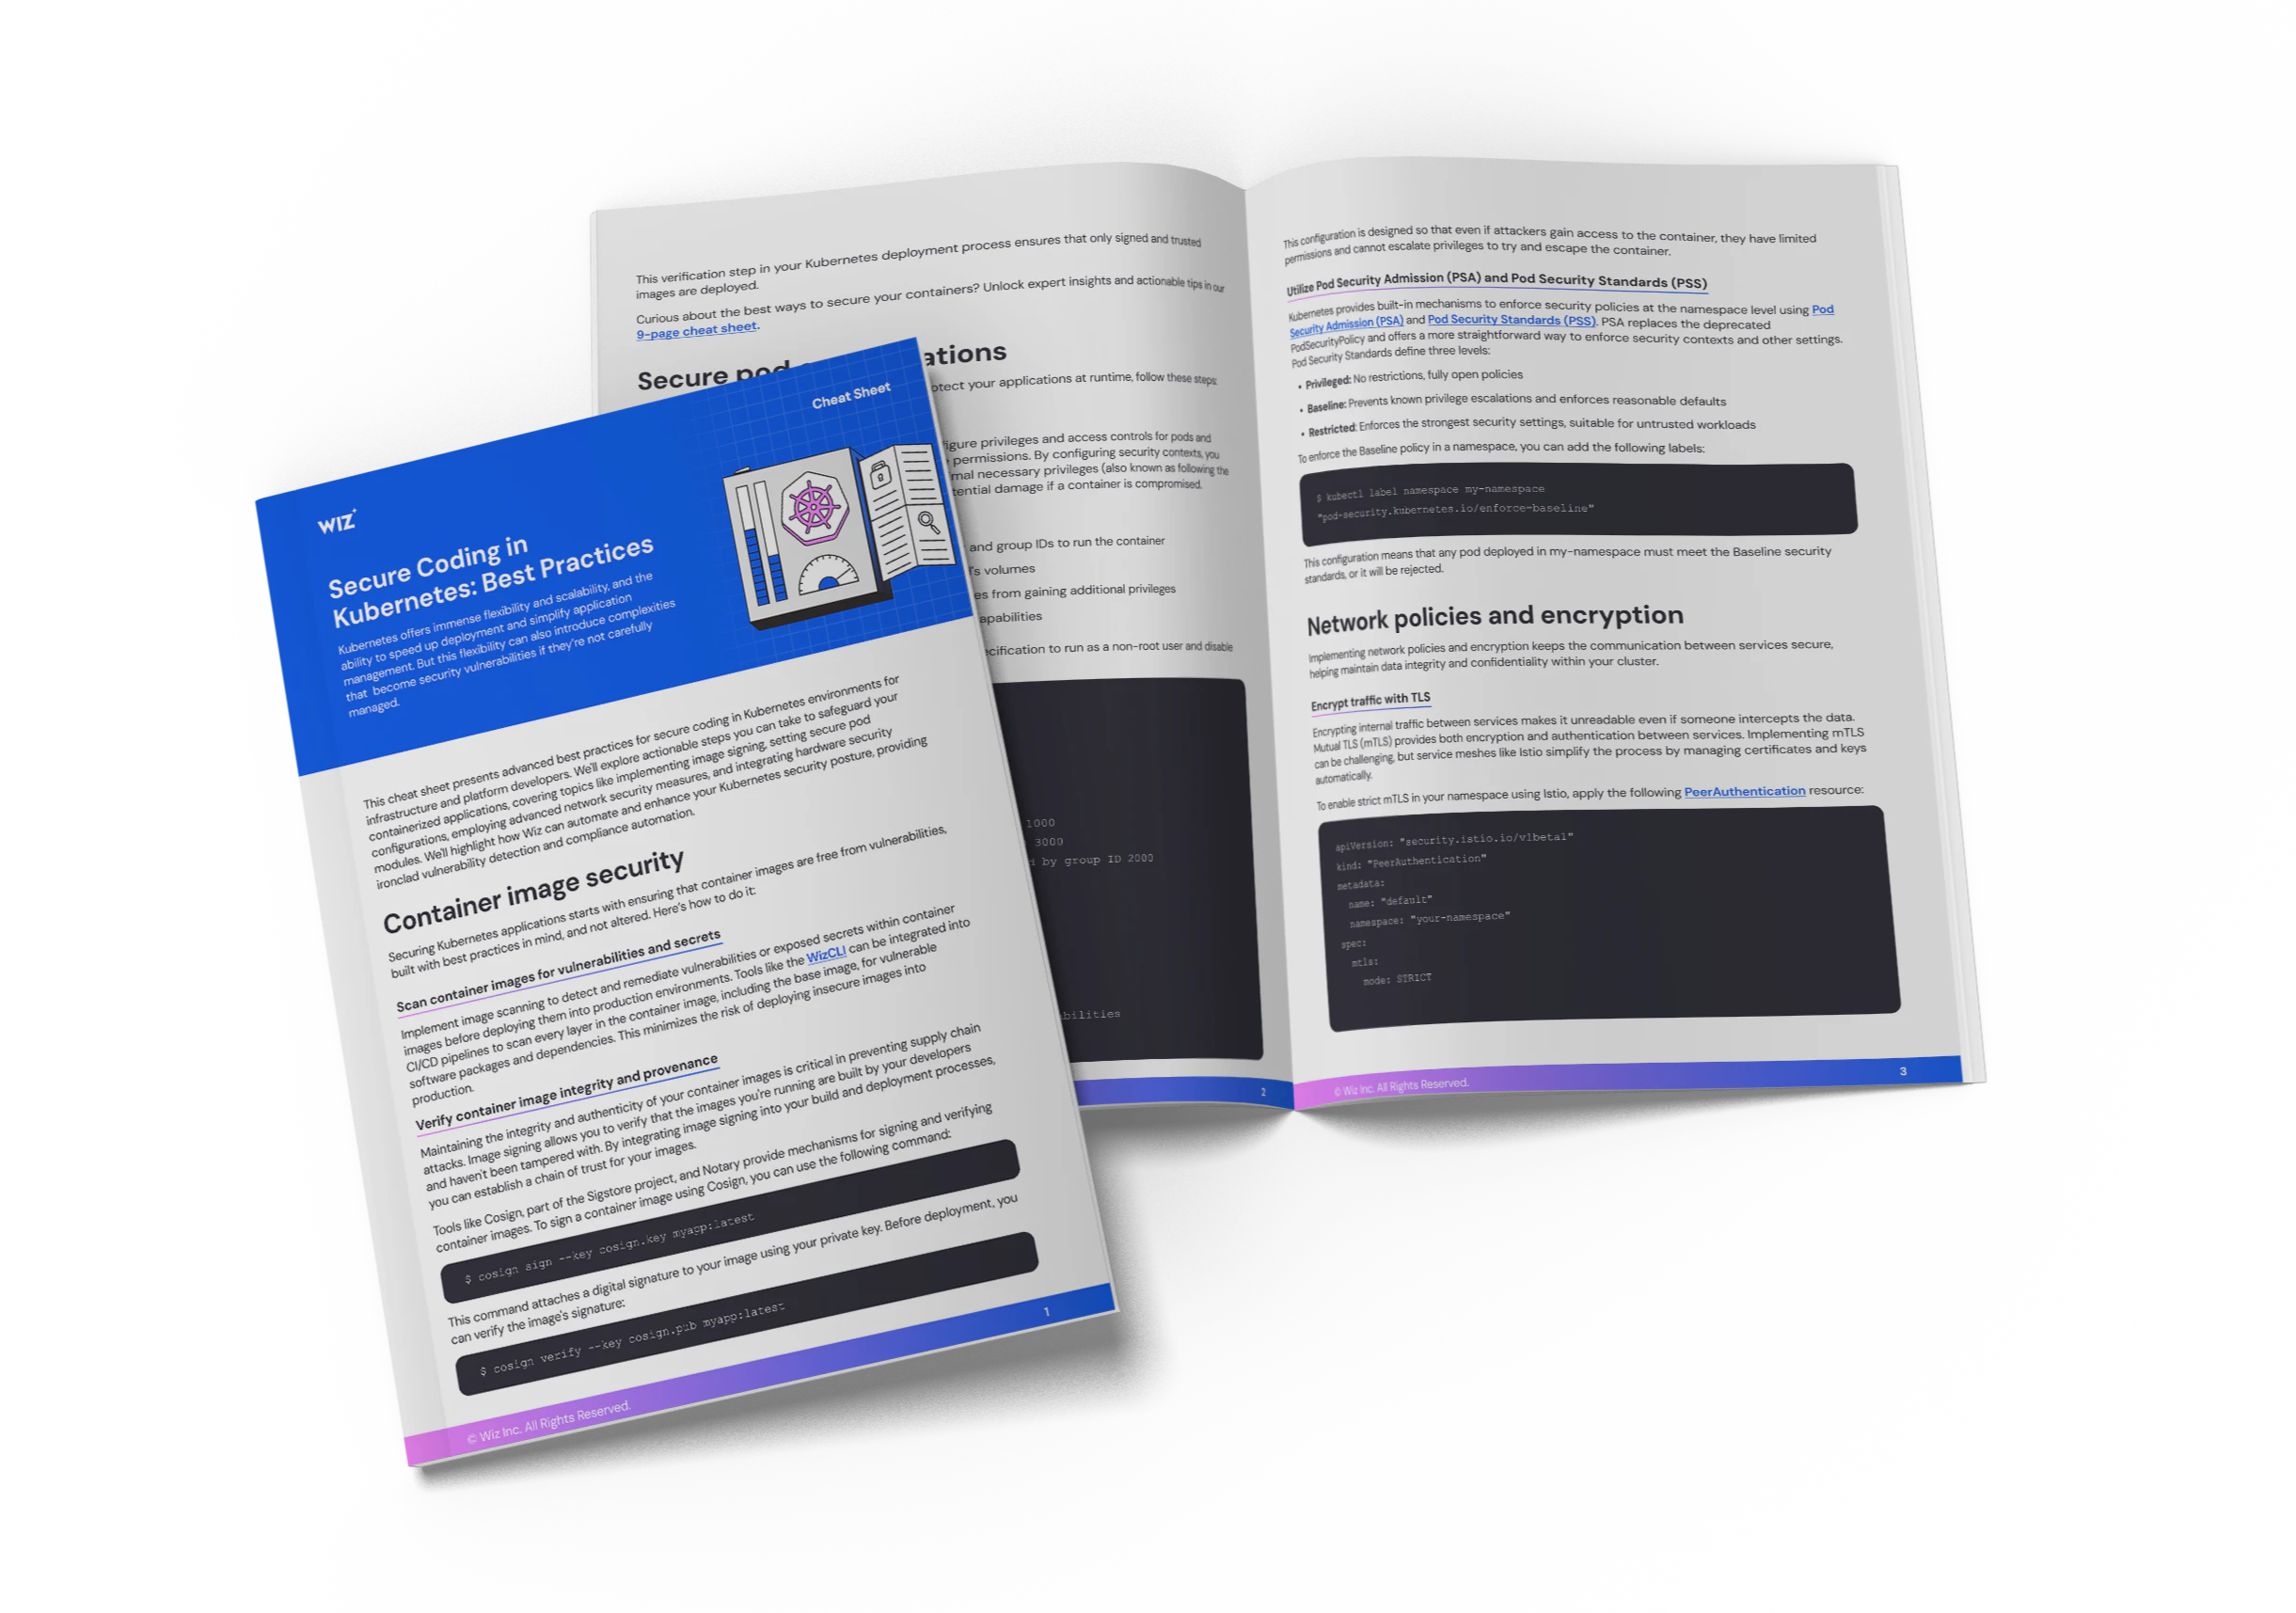
Kubernetes Secure Coding Practices [Cheat Sheet]
This 10 page cheat sheet provides advanced, actionable guidance for infrastructure and platform developers to safeguard containerized applications.
Download PDF
Resource management
Before you spin up containers for training or inference, it’s important to be sure that cluster resources match the intensity of your workloads. After all, ignoring GPU demands or skipping proper CPU sizing leads to slow performance, random out-of-memory kills, and disappointed teams.
GPU and specialized hardware allocation
GPUs, TPUs, and other accelerators are like the sports cars in a cluster's garage. They let you train massive models or handle huge throughput during inference. Making these hardware resources available inside pods relies on device plugins provided by Kubernetes. For instance, by adding the official NVIDIA device plugin, you can request GPU slices per pod.
One important tip? Setting proper resource requests ensures the scheduler spots the right node with the correct GPU. If you skip those resource definitions, your workload might land on a node without the accelerator, causing job failures. It’s also helpful to label GPU nodes with something like nvidia.com/gpu=true to target them via nodeSelector or nodeAffinity easily.
The code snippet below shows a basic pod specification that asks for one GPU from NVIDIA:
apiVersion: v1
kind: Pod
metadata:
  name: gpu-training-pod
spec:
  containers:
  - name: gpu-training-container
    image: nvcr.io/nvidia/tensorflow:22.01-tf2-py3
    resources:
      limits:
        nvidia.com/gpu: 1
  nodeSelector:
    nvidia.com/gpu: "true"
CPU and memory sizing
Not every data pipeline or model training job needs a GPU. Many tasks run perfectly fine on CPUs if you size them correctly. By setting requests and limits, the Kubernetes scheduler knows how many pods fit on a node. Without these parameters, you risk poor scheduling or pods competing for the same CPU cores. To take scheduling to the next level, add cluster autoscaling to absorb sudden spikes in traffic or training jobs.
Remember to watch actual usage metrics carefully, using a monitoring system like Prometheus. If pods consistently hit 90% CPU, adjust the requests slightly. On the flip side, if pods stay around 20% CPU usage, you can reduce their requests.
Below is an example deployment that defines CPU and memory requests and limits:
apiVersion: apps/v1
kind: Deployment
metadata:
  name: ml-inference-deployment
spec:
  replicas: 2
  template:
    spec:
      containers:
      - name: ml-inference-container
        image: your-registry/ml-inference:latest
        resources:
          requests:
            cpu: "500m"
            memory: "512Mi"
          limits:
            cpu: "1000m"
            memory: "1024Mi"
Scaling your AI/ML workloads
Once you've pinned down how to request and allocate resources, it’s time to scale. In some scenarios, you’ll be scaling inference pods horizontally to handle spiky incoming requests. In others, you’ll be scheduling large training jobs that might need specialized node types.
Horizontal and vertical scaling
Horizontal scaling is what you need to deal with unpredictable user loads, especially for inference endpoints. It’s best practice to set up HPAs to watch CPU or GPU usage, then spin up new pods when things heat up. Still, vertical scaling can be a better answer if your container needs more memory or CPU cores on a single node. The Vertical Pod Autoscaler (VPA) can help you tweak requests for stable workloads over time.
Here's a snippet of an HPA referencing a deployment by CPU usage:
apiVersion: autoscaling/v2
kind: HorizontalPodAutoscaler
metadata:
  name: inference-hpa
spec:
  scaleTargetRef:
    apiVersion: apps/v1
    kind: Deployment
    name: inference-deployment
  minReplicas: 2
  maxReplicas: 15
  metrics:
  - type: Resource
    resource:
      name: cpu
      target:
        type: Utilization
        averageUtilization: 75
Batch jobs and scheduling
Large-scale training is often better as a batch process. To simplify your pipeline, use Kubernetes Jobs for one-off experiments and CronJobs for scheduled tasks like nightly retraining. By taking this approach, each successful job run means the model or artifact can be automatically stored somewhere for further use.
A well-structured batch job ensures long-running training tasks do not overload your cluster nodes. To achieve this, you can request GPU or CPU resources in the same manner as any other pod, making sure you manage them effectively.
Below is a CronJob that launches a nightly training run:
apiVersion: batch/v1
kind: CronJob
metadata:
  name: nightly-model-training
spec:
  schedule: "0 2 * * *"
  jobTemplate:
    spec:
      template:
        spec:
          containers:
          - name: training-container
            image: your-registry/training-image:latest
            resources:
              limits:
                nvidia.com/gpu: 1
            command: ["python", "train.py"]
          restartPolicy: Never
Multi-cluster and hybrid strategies
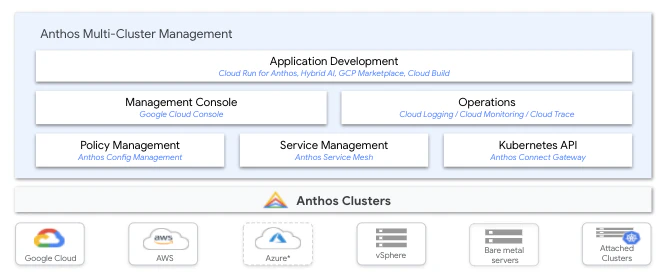
Sometimes it’s necessary to spread workloads across multiple Kubernetes clusters, especially if you want redundancy or to run some jobs on-prem and others in the cloud. This can save money and reduce risk. Tools like Anthos offer a management console that shows how jobs are distributed. If there's a problem in one environment, you can fail over to another, giving you peace of mind when you're juggling critical user-facing inference tasks.
Storage and data management
Once your jobs can scale efficiently, data takes center stage. Where is it stored? How quickly can you read it? How do you back it up? These questions pop up a lot when dealing with large training datasets, and they’re crucial to preventing data retrieval from becoming a bottleneck.
High-performance storage classes
StorageClasses backed by SSDs are ideal for training workloads with big read/write demands. To make the most of them, define a PersistentVolumeClaim (PVC) that references the right StorageClass and the cluster provisions suitable for backing storage. Also, be sure to monitor read/write IOPS (input/output operations per second) to confirm that your storage volumes can handle the required throughput.
Below is a PVC that asks for a high-performance storage class:
piVersion: v1
kind: PersistentVolumeClaim
metadata:
  name: fast-pvc
spec:
  accessModes:
    - ReadWriteOnce
  storageClassName: high-perf-ssd
  resources:
    requests:
      storage: 100Gi
Data locality and caching
In distributed training, data locality matters. When workers grab data from remote volumes, network latency can cause slowdowns. The solution? Place caching layers in front of remote storage or pick node-local SSD volumes. Another strategy is to run a caching sidecar container in the same pod, which handles data reads and writes, improving performance in specific workflows.
The snippet below shows a sidecar container that provides caching for training data:
apiVersion: apps/v1
kind: Deployment
metadata:
  name: training-deployment
spec:
  replicas: 2
  selector:
    matchLabels:
      app: training-app
  template:
    metadata:
      labels:
        app: training-app
    spec:
      containers:
      - name: caching-sidecar
        image: your-registry/caching-sidecar:latest
        volumeMounts:
          - name: cache-volume
            mountPath: /cache
      - name: training-container
        image: your-registry/training-image:latest
        volumeMounts:
          - name: cache-volume
            mountPath: /dataset
      volumes:
        - name: cache-volume
          emptyDir: {}
Backup and versioning
Tracking model versions is standard for good reason: If new models fail in production (hey, it happens!), you’ll need frequent rollbacks. Along with storing model artifacts in object storage, it’s also important to run scheduled backups. Even if you're using a cloud service that provides auto-backups, extra backups are the way to go to prevent problems down the line.
Below is an Argo Workflow that uploads model artifacts to a remote bucket in S3:
apiVersion: argoproj.io/v1alpha1
kind: Workflow
metadata:
  generateName: model-backup-
spec:
  entrypoint: backup-model
  templates:
  - name: backup-model
    container:
      image: your-registry/backup-tool:latest
      command: ["backup-model"]
      args: ["--model-path=/models", "--destination=s3://ml-backups"]
Security considerations
We've all seen the headlines about clusters being hijacked or data being exfiltrated—like the May 2024 unauthorized access incident at Hugging Face where attackers targeted their AI model hosting platform. These breaches highlight why Kubernetes security and AI security have become a huge priority. When you combine containerized workloads with advanced ML pipelines, threat vectors multiply fast. Let's walk through a few ways to keep these risks in check.
25 AI Agents. 257 Real Attacks. Who Wins?
From zero-day discovery to cloud privilege escalation, we tested 25 agent-model combinations on 257 real-world offensive security challenges. The results might surprise you 👀

Fundamentals of Kubernetes security
To strengthen security, follow these best practices:
Scan container images to detect vulnerabilities before deployment.
Enforce role-based access control (RBAC) to restrict who can deploy, modify, or delete workloads.
Apply Pod Security Standards (PSS) to prevent misconfigurations that could expose clusters to threats.
Limit access to container registries and monitor for unauthorized changes.
Tag images with stable references to ensure only verified versions are used in production.
Here's an RBAC snippet that grants minimal privileges to a namespace:
kind: Role
apiVersion: rbac.authorization.k8s.io/v1
metadata:
  namespace: ml-project
  name: ml-project-role
rules:
- apiGroups: ["", "apps"]
  resources: ["pods", "deployments"]
  verbs: ["get", "list", "create", "update", "delete"]
---
kind: RoleBinding
apiVersion: rbac.authorization.k8s.io/v1
metadata:
  name: ml-project-rolebinding
  namespace: ml-project
subjects:
- kind: User
  name: ml-user
  apiGroup: rbac.authorization.k8s.io
roleRef:
  kind: Role
  name: ml-project-role
  apiGroup: rbac.authorization.k8s.io
Model integrity protection
As AI models become more powerful and widely deployed, they also become targets for adversarial attacks, data poisoning, and distribution drift. Attackers may manipulate training data to undermine model performance or exploit weaknesses in the model’s logic.
To mitigate these threats, monitor incoming data for anomalies, use drift detection tools to spot when your model’s real-world performance starts slipping, and train (or retrain) only on vetted datasets. Maintaining this vigilance helps ensure your model stays accurate and resilient in the face of evolving threats.
Below is a sample Python snippet showing how you can use the Alibi Detect library to detect data drift:
from alibi_detect.cd import KSDrift
import numpy as np

# Reference data (e.g. baseline training data)
X_ref = np.random.rand(1000, 10)

# New incoming data (e.g. live traffic samples)
X = np.random.rand(1000, 10)  # Replace with actual production data

# Initialize the drift detector
cd = KSDrift(X_ref, p_val=0.05)

# Run drift check
preds = cd.predict(X)

if preds['data_drift']:
    print("Data drift detected! P-value:", preds['p_val'])
    # Optionally, trigger a retraining pipeline or alert
else:
    print("No data drift detected. P-value:", preds['p_val'])
Image signing
Once you’ve taken steps to preserve model integrity, the next layer of defense is confirming a model’s authenticity by signing container images that hold your model artifacts. Tools like Cosign make it straightforward to add digital signatures, while encryption at rest and a chain of custody for training data help further safeguard your ecosystem—especially in regulated industries.
You can sign your container image with a simple Cosign command:
$ cosign sign --key cosign.key your-registry/your-image:tagOn top of that, add automated code scanning steps in CI pipelines. This helps catch potential vulnerabilities in dependencies before they reach production. Below is a code snippet that integrates Trivy, an open-source security scanner, into a GitHub Actions pipeline:
name: code-scanning-workflow
on: [push, pull_request]
jobs:
  scan:
    runs-on: ubuntu-latest
    steps:
    - uses: actions/checkout@v2
    - name: Scan with Trivy
      uses: aquasecurity/trivy-action@master
      with:
        image-ref: "your-registry/your-image:latest"
        format: "table"
Network isolation and zero trust
Securing AI workloads starts with strong network isolation. One effective approach is to define NetworkPolicies that restrict which pods and namespaces can communicate with each other. Beyond that, it's best practice to avoid running AI/ML workloads alongside other applications in the same cluster. By segmenting workloads based on purpose—such as separating inference services from general web applications—you minimize the risk of lateral movement in case of a breach.
This approach aligns with zero-trust principles, where every piece of network traffic is treated cautiously, even if it's internal to the cluster. Combined with strong identity access management, these guardrails help prevent accidental data leaks and infiltration attempts.
Here's a NetworkPolicy that limits traffic to only the inference namespace:
apiVersion: networking.k8s.io/v1
kind: NetworkPolicy
metadata:
  name: allow-namespace-traffic
  namespace: inference
spec:
  podSelector: {}
  ingress:
  - from:
    - namespaceSelector:
        matchLabels:
          purpose: inference
End-to-end visibility: From code to runtime
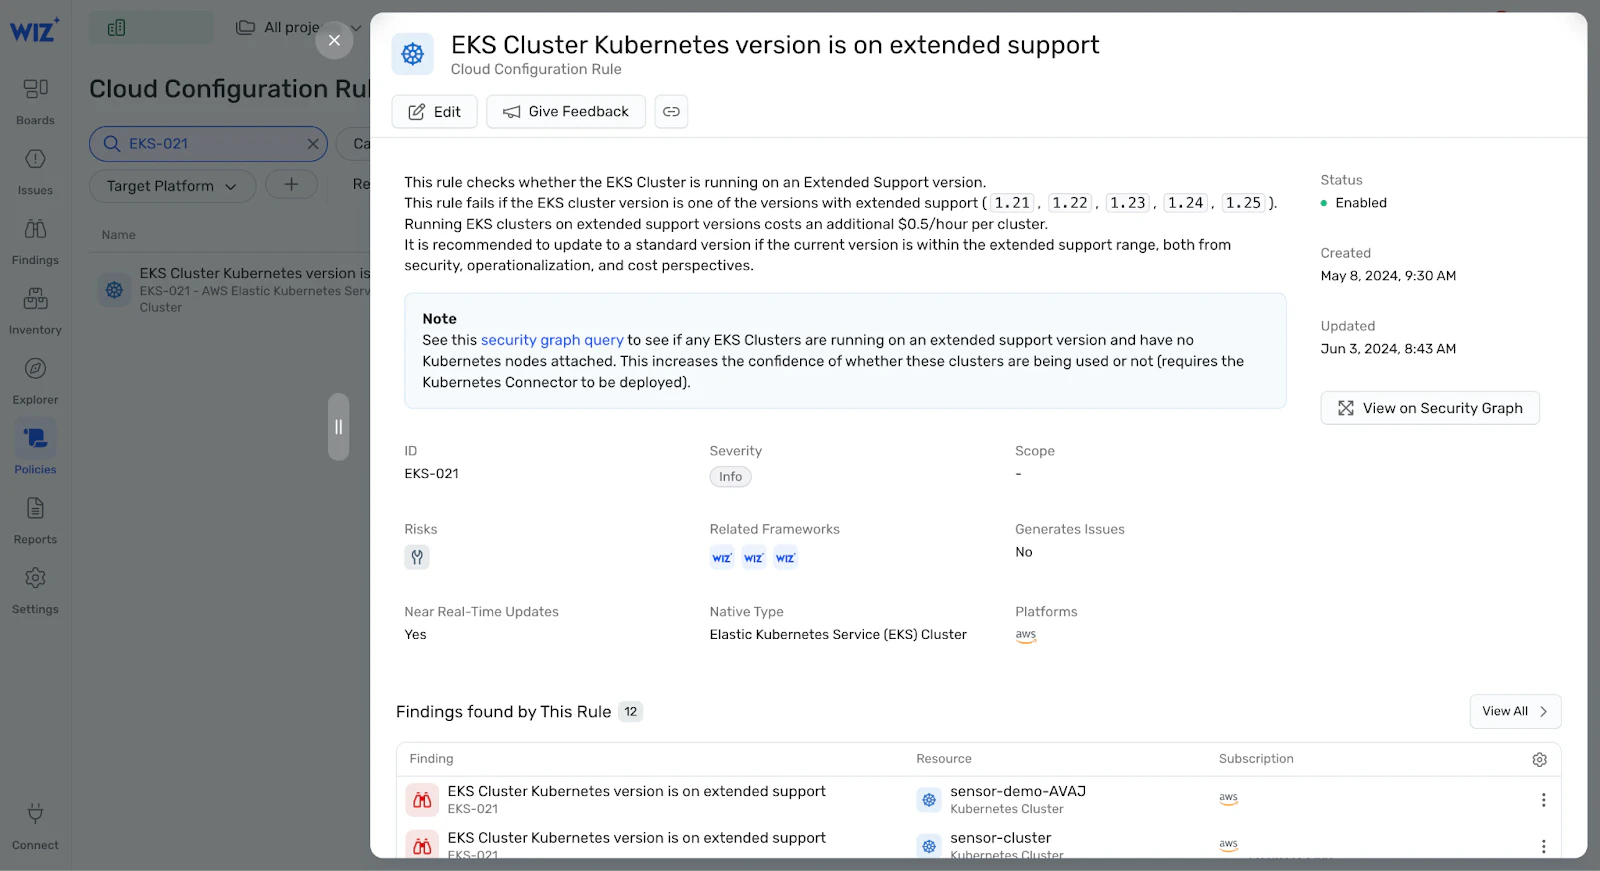
AI/ML workloads introduce complex security and compliance challenges that span the entire lifecycle—from code development to runtime execution. Without full visibility, misconfigurations, vulnerabilities, and drift can creep into your Kubernetes clusters, increasing the risk of breaches.
To tackle this, teams need a security strategy that covers every stage of the AI pipeline: scanning infrastructure-as-code (IaC) configurations, securing container images, enforcing runtime protections, and continuously monitoring for anomalies. By integrating security controls across the pipeline, you ensure that AI workloads remain resilient and compliant.
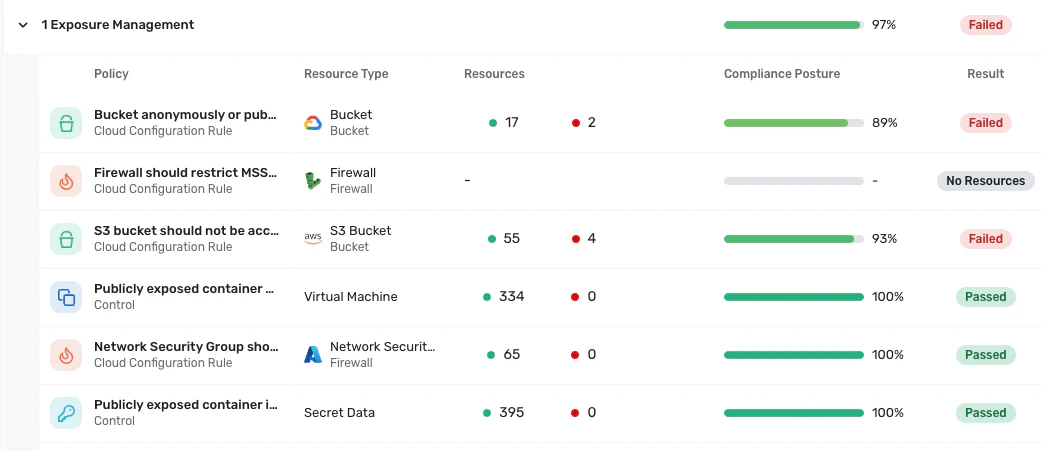
Wiz offers a platform that allows you to track vulnerabilities, compliance issues, and security posture across your cluster in real time. Take advantage of the Wiz dashboard to spot container image problems, misconfigurations, and even secrets lurking in code:
Observability: Monitoring, logging and tracing
When tuning your cluster for machine learning workloads, you’re aiming for a crystal-clear view of what's happening. That means collecting metrics from pods, storing logs in a centralized location, and tracking requests across microservices. Thorough observability makes troubleshooting a no-brainer when something misfires.
Metrics and alerting
Prometheus usually sits at the heart of your monitoring stack, helping you track key performance metrics. To ensure smooth AI/ML operations, use a combination of tools:
Prometheus collects CPU, memory, and GPU usage metrics from model inference services.
Grafana provides real-time dashboards to visualize cluster performance and detect anomalies.
Alerting rules automatically trigger notifications (e.g., Slack alerts) when resource usage exceeds defined thresholds.
By combining these tools, you maintain full visibility into AI workloads and can quickly respond to performance issues before they impact production.
Below is a PrometheusRule that alerts on high GPU usage:
apiVersion: monitoring.coreos.com/v1
kind: PrometheusRule
metadata:
  name: gpu-usage-rules
  namespace: monitoring
spec:
  groups:
  - name: gpu-alerts
    rules:
    - alert: HighGPUUsage
      expr: nvidia_gpu_utilization > 90
      for: 5m
      labels:
        severity: warning
      annotations:
        summary: "High GPU usage detected"
Distributed tracing and performance insights
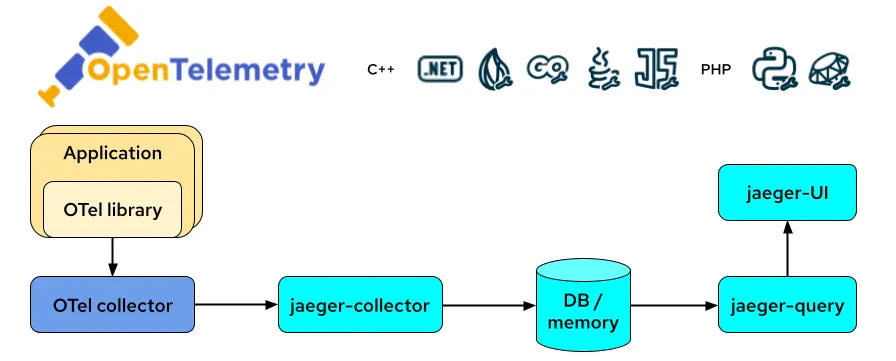
OpenTelemetry is a great choice for distributed tracing, especially if your AI pipeline includes multiple microservices. Each service emits trace spans, helping you pinpoint where a bottleneck might exist. This approach is priceless when debugging slow requests or random performance anomalies in data processing flows.
Here’s how OpenTelemetry Collector and Jaeger work together to provide end-to-end tracing and performance insights for AI/ML workloads:
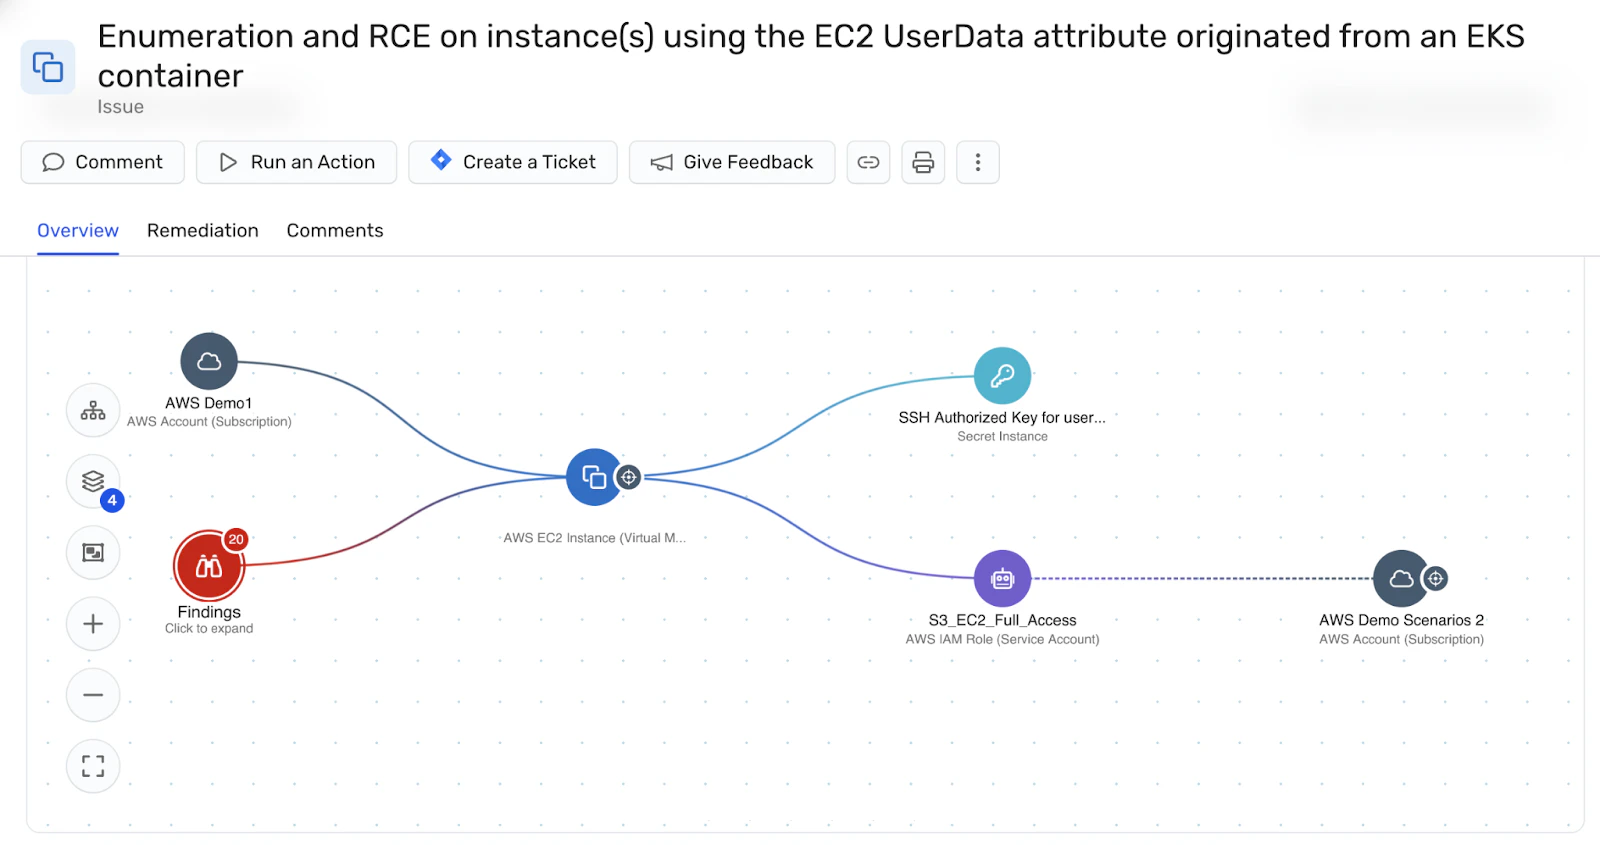
Correlating security and performance with Wiz
Sometimes, a performance drop is tied to a security-related event. Wiz helps you see that correlation by blending security findings with performance data. Maybe a suspicious process is hogging GPU resources or a known vulnerability is leading to cluster instability. When you see these patterns, Wiz prompts an immediate fix.
🚨Kubernetes Security Research Report 2025
New insights from 200,000+ cloud accounts uncovers the latest risks, attack trends, and security gaps in Kubernetes environments.
Download PDF
CI/CD for AI/ML workflows
We all know shipping a trained model involves more than just copying a file. You want to fully automate building, testing, and deploying ML artifacts. This is where CI/CD pipelines come in handy. You can chain tasks that run tests, scan images, push them to a registry, and then roll out new versions to production.
Automating model lifecycle management
Tools like Tekton or Argo Workflows let you define pipelines for the entire model lifecycle, from data prep to training to deployment. Each stage is triggered automatically whenever you commit a change, which keeps the process consistent. You can also add validation checks to ensure a model meets predefined accuracy thresholds before tagging it for production. This helps prevent underperforming models from being deployed and impacting user experience.
Below is a Tekton PipelineRun that kicks off model building and deployment:
apiVersion: tekton.dev/v1beta1
kind: PipelineRun
metadata:
  name: ml-pipeline-run
spec:
  pipelineRef:
    name: ml-build-deploy-pipeline
  workspaces:
  - name: shared-data
    volumeClaimTemplate:
      spec:
        accessModes: ["ReadWriteOnce"]
        resources:
          requests:
            storage: 5Gi
  params:
  - name: model-name
    value: "my-ml-model"
Immutable artifacts and GitOps
It’s handy to tag images with commit hashes so you know exactly which version of the code or model you're running. GitOps extends that practice by letting you store Kubernetes manifests in a Git repo. Any changes to those manifests are automatically applied to the cluster in a controlled manner. This method helps you track precisely when and why changes happen.
Here's an Argo CD Application referencing Git repository for managing deployment configurations:
apiVersion: argoproj.io/v1alpha1
kind: Application
metadata:
  name: ml-inference-app
spec:
  destination:
    namespace: ml-inference
    server: https://kubernetes.default.svc
  source:
    repoURL: 'https://github.com/your-org/ml-deploy-configs.git'
    targetRevision: main
    path: manifests/inference
  project: default
  syncPolicy:
    automated:
      prune: true
      selfHeal: true
Performance optimization
Models have to respond quickly and not waste expensive GPU or CPU hours. Luckily, minor tweaks in HPA parameters or load balancing rules can shave off precious milliseconds and reduce costs by a solid margin.
Load balancing
Load balancing with Ingress resources helps route traffic to the right inference service. To separate different versions of a model, you have the option to use path-based routing.
Below is an Ingress with path-based routing to multiple inference services:
apiVersion: networking.k8s.io/v1
kind: Ingress
metadata:
  name: inference-ingress
spec:
  rules:
  - host: ml.example.com
    http:
      paths:
      - path: /v1/
        pathType: Prefix
        backend:
          service:
            name: inference-model-v1
            port:
              number: 8081
      - path: /v2/
        pathType: Prefix
        backend:
          service:
            name: inference-model-v2
            port:
              number: 8081
Cost profiling and optimization
Everyone likes to watch how their GPU nodes, CPU nodes, and memory usage line up with spending. But manually adjusting resources can be time-consuming and inefficient. That’s where tools like Karpenter and Autopilot can automatically scale cluster nodes to match resource demands, saving you from manual node provisioning. For training workloads that don’t need persistent compute, leveraging Spot Instances can dramatically reduce costs—just make sure your pipeline can handle potential interruptions.
Below is an example of Karpenter configuration for matching instance types to workloads:
apiVersion: karpenter.sh/v1alpha5
kind: Provisioner
metadata:
  name: default
spec:
  requirements:
    - key: "node.kubernetes.io/instance-type"
      operator: In
      values: ["m5.large", "m5.xlarge"]
  provider:
    subnetSelector:
      karpenter.sh/discovery: "my-cluster"
    securityGroupSelector:
      karpenter.sh/discovery: "my-cluster"
Another way to save big? Use a tool like Wiz to see if there are cost drivers related to misconfigured resources or unusual usage patterns. Wiz also helps you harden the nodes during creation to make sure that they are not only automatically scaled but also secure.
Conclusion
We've talked through various strategies for machine learning workflows on Kubernetes. From resource management to AI security best practices to hooking up Tekton pipelines, we've seen how each piece can contribute to a stable platform. The main idea is to keep an eye on AI security risks, watch for cost overruns, and build a pipeline that folks trust.
When you implement these best practices, you minimize cluster disruptions and help data scientists push updates confidently. We're excited to see how these suggestions fit into your work. We'd love to hear back about what you create, the lessons you uncover, and how you keep leveling up your machine learning in Kubernetes workflows.
This journey might feel complicated, but with the right tools—like Wiz's real-time scanning, dashboards, and compliance features—you can build a safer environment for training and inference. If you're looking to refine and scale your AI/ML projects while staying secure, give Wiz a shot for a sweeping view of container vulnerabilities, cluster settings, and compliance benchmarks. With Wiz, you can keep your clusters healthy, cost efficient, and safe from intrusions.
Secure your cloud from code to production
Learn why the fastest growing companies choose Wiz to secure containers, Kubernetes, and cloud environments from build-time to real-time.
